Without any doubt you’ve heard these words and have even used it. But what are really a support and a resistance. This may seem simple at first sight but I’m sure for some people, these concepts are not clear.
What is a support or a resistance? How to determine resistance or support? When can it be considered a resistance or a support has been broken? How to identify false breaks? What is an area of support or resistance? What are all types of supports and resistances? So many questions I will try to answer. But let’s start at the beginning; after all we are here to learn!
What is a Resistance and a Support?
Avoid any bla bla and just talking simply.
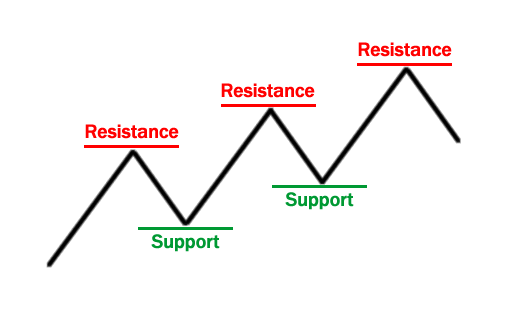
Resistance is formed by the highest point reached before a reversal.
Support is formed by the lowest point reached before a reversal.
As everyone knows, the market does not evolve in a straight line. The market follows a trend, but in this trend, there are correction movements. These movements are constantly forming new resistances and supports as you can see in the scheme below:
How to determine a support or a resistance ?
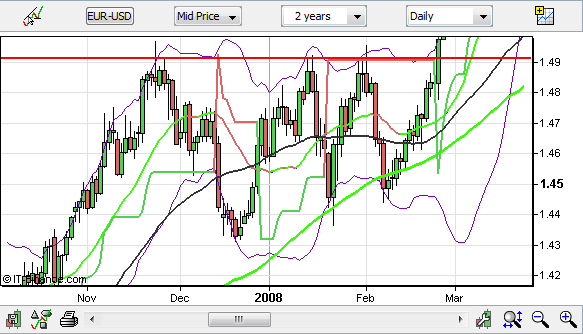
To draw a resistance or a support, it is necessary to have at least two high points in the case of a resistance or two low points in the case of a support, to use the level. A third point will allow next the validation of the level. It can be seen in the example below that it is important to wait at least for two high points before drawing a resistance. The first high is actually a slight anomaly because next the price showed that the level of resistance was lower the first high. The 3rd point of contact allows us to validate the resistance.
Test or break out?
Resistances or supports can be tested without being broken. This is often the case if these lines play their role. Resistance testing is not only the fact that the price makes a reversal when the resistance is touched. It is unusual when it is so perfect like this. That would be too easy otherwise. The test of resistance can bring the price above the line of resistance. But beware, this does not mean that the resistance was broken. Generally, a resistance is broken when the closing price is above the line of resistance. If the line is only crossed during the trading day but not at the end of the trading day, then it was only a test. To make it clearly visible on charts, we use Japanese candlesticks. Thus, we can see the higher of the day but also the closing price. The example below is a perfect example of what I explained to you, namely a test of resistance. The small dotted blue square is the interesting area :
The opposite is also true for supports.
Now we are going to take a look at a real break out. There are several conditions that are often seen when a level of resistance or support is broken:
– The close price of the candlestick should be above the level of resistance. It is even sometimes necessary to have two consecutive candlesticks that are closing above or below the level
– There is often an acceleration of the movement. This acceleration is seen by the presence of long candlesticks that reflect the strength of the movement
False break
Above, I’ve mentioned conditions that show if a level is broken or not. So if you see one or the other of the two conditions not fulfilled, it becomes easy to identify false breaks. We will then speak of a test.
As I said, when a level is broken, there is often an acceleration of the movement. If prices are stagnating or declining the next session, it may be a false break. Thereafter, the price will fall under the line of resistance. This is called a false break. Here’s an example below. The two arrows indicate the two false breaks:
If a false break occurs, this reinforces the resistance. The reverse is also true for supports. False breaks are often due to irrational behavior. Prices go up and seeing this, investors want to take advantage of the movement and also buy. So, the resistance is broken, but at this moment, investors are realizing that there was no reason to break the resistance and prices fall.
Supports and resistances areas
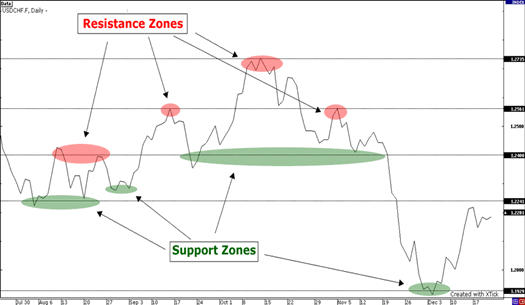
The second advice I will give you is to function not with lines but with areas to determine supports and resistances. Indeed, we have seen that there are sometimes false breaks. To identify them more easily on a chart, you should work with lines. Thus there will be only the closing price on your chart and it will be easier for you to identify areas. We can compare these areas to hills (for resistance) and valleys (for supports). This is what a graphic in line looks like:
All types of supports and resistances
Resistances and supports are more or less strong. Forces depend on two criteria.
The first one is the number of times that these lines were tested. More the line is tested, stronger is the line. Usually it is at the 4th test that the line is broken. The second criterion is the time scale on which the resistance or support is linked. If it is a short-term resistance, it will be easier to break. More the line is long term, more difficult it will be to break it. Indeed, the long term is defined by the general trend of a currency pair. Break a resistance or a long term support would mark a significant change in the trend. Indeed, LT resistance is formed by the highest reached over the years sometimes. Here is a scheme below that explaining this:
Resistance, support and pivot point calculation
|
– Resistance 3 = H + 2( Pivot – L ) – Resistance 2 = Pivot + ( H – L ) – Resistance 1 = ( 2 x Pivot ) – L – Point Pivot = ( H + L + C ) / 3 – Support 1 = ( 2 x Pivot ) – H – Support 2 = Pivot – ( H – L ) – Support 3 = L – 2( H – Pivot ) |


