There is no one profitable trading style or trading strategy when it comes to Forex trading. Every trader uses a trading style that fits their strategy the best. Some traders prefer scalping while others prefer swing trading. In this blog, we will delve into what swing trading is and what are the best indicators that could potentially provide profitable trading set-ups.
What is Swing Trading?
Swing trading is a popular trading strategy employed in financial markets. It aims to capture short-to-medium-term price movements within an established trend. Swing traders attempt to profit from the price swings or oscillations that occur between support and resistance levels. It is akin to riding the waves of an ocean; you’re trying to catch the crest of the wave before it recedes and take advantage of the momentum it provides.
Unlike day trading, which involves closing positions before the market closes for the day, swing traders hold positions for a few days to several weeks. The goal of swing trading is to capture larger price movements, and thus the strategies employed have a longer-term outlook than those used in day trading.
This trading style allows traders to benefit from longer-term trends, as well as shorter-term movements. It requires patience and discipline, as traders must wait for the right opportunities to enter and exit the market. It also requires a greater understanding of market fundamentals and technical analysis to identify potential entry and exit points, trends, patterns, and indicators that suggest a reversal or continuation of the current price movement which we will touch upon later in this blog.
Firstly, as always, let us first visualize through the illustration below the two major legs (price moves) every swing trader is looking for:
Swing traders will watch out for the following:
- Swing highs: This is observed for exiting the buy (long) position in a Bull Market in anticipation of a retracement after a high is formed or entering a sell (short) position in a Bear Market for a further leg move to form a new low.
- Swing lows: This is observed for entering the buy (long) position in a Bull Market in anticipation of a further move to a new high or exiting a sell (short) position in a Bear Market in anticipation of a retracement to a swing high.
- Timeframe: For swing trades, since the traders are looking to catch relatively higher pip movement over a longer duration, the minimum time frame is 1 hour. Ideally, swing traders rely on a 4-hour time frame to determine their directional bias to follow the trend. Only after that, the smaller time frames can be used to perfectly position your entry and exit level on the trade.
With that in mind, let us now quickly dive into the indicators that may assist in executing positions for a swing trade.
Moving Averages
Moving averages are commonly used in swing trading to identify trends, potential entry, and exit points, and to filter out market noise. Two key moving averages to keep an eye on are:
20-day moving average (MA)
A 20-day moving average is a type of moving average that calculates the average price of a security over the past 20 trading days. It is a commonly used time frame for short-term analysis in swing trading
50-day moving average (MA)
A 50-day moving average is a type of moving average that calculates the average price of a security over the past 20 trading days. It is a commonly used time frame for medium to long term analysis in swing trading.
Here are a few ways moving averages can be utilized in swing trading:
Trend Identification
Moving averages help identify the direction of the trend. Traders often use a combination of shorter-term and longer-term moving averages to determine the overall trend. For example, if the shorter-term moving average (such as the 20-day moving average) is above the longer-term moving average (such as the 50-day moving average), it may suggest an uptrend. Conversely, if the shorter-term moving average is below the longer-term moving average, it may indicate a downtrend.
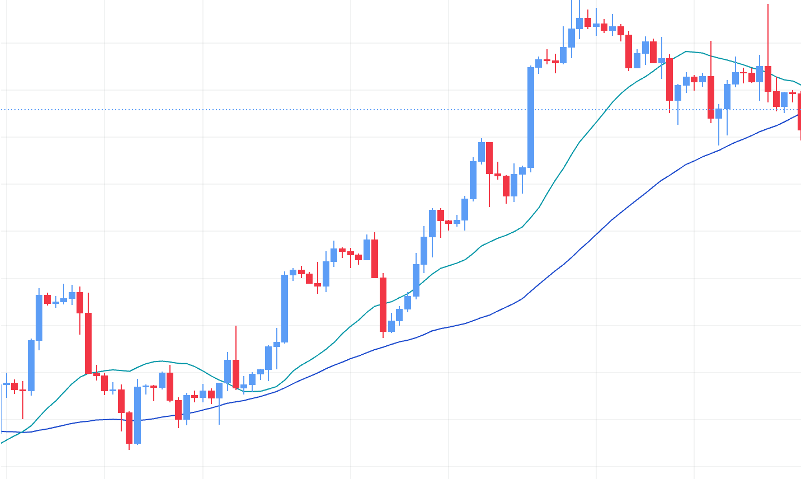
In the image below the green line is the 20-day moving average while the blue line is the 50-day moving average. With 20-day MA>50-day MA, we can see that the market is in an uptrend. On the contrary, if 20-day MA<50-day MA, the market would be in a downtrend. This identification of trends helps the swing traders determine the direction bias to execute the trade entry in favour of the trend.
Moving Average Crossovers
Swing traders often pay attention to moving average crossovers as potential entry or exit signals. A bullish crossover occurs when a shorter-term moving average (e.g., 20-day) crosses above a longer-term moving average (e.g., 50-day), signaling a potential buying opportunity. On the other hand, a bearish crossover occurs when the shorter-term moving average crosses below the longer-term moving average, suggesting a potential selling opportunity.
In the image below 20-day MA has crossed over the 50-day MA above, hence an indication for a buy (long) position.
(Please note that the best timeframe to analyze this would be between 1H-4H to be able to capture decent pip size on an instrument over a longer duration i.e., over a few hours to a few days)
Moving Average as a Support and Resistance Levels
Moving averages can act as support or resistance levels. When the price approaches a moving average from below and bounces off it, it may serve as a support level. Conversely, when the price approaches a moving average from above and finds resistance, the moving average can act as a resistance level. Swing traders may look for price reversals or breakouts at these levels as potential entry or exit points.
It’s important to note that moving averages are lagging indicators, meaning they are based on past price data. As a result, they may not always provide timely signals, especially in rapidly changing market conditions. It’s recommended to use moving averages in conjunction with other technical analysis tools and to consider the overall market context before making trading decisions. To learn more, you may refer to our blog about moving averages.
Moving Average Convergence Divergence (MACD) and Relative Strength Index (RSI)
Moving average convergence divergence (MACD) calculates the difference between the 26-period exponential moving average (EMA) and the 12-period EMA. The resulting outcome gives us the MACD line. Next, a nine-day EMA is taken of the MACD line which is known as the signal line. This signal line then acts as a key factor in deciding the momentum.
- If MACD line > Signal line (crosses above the signal line), it indicates a buy momentum
- If MACD line < Signal line (crosses below the signal line), it indicates a sell momentum.
Relative strength Index (RSI)on the other hand, is a momentum indicator that helps in identifying whether the market for any particular pair/instrument is overbought or oversold.
An overbought condition (a reading of 70 or above) implies the exhaustion of buying pressure thus indicating an imminent sell momentum. Conversely, an oversold condition (a reading of 30 or below) implies the exhaustion of selling pressure thus indicating an imminent buy momentum. RSI is a line graph with a reading from 0 to 100.
These indicators can be used by swing traders to identify the divergence in 1H-4H timeframes in order to capture big price movements. Divergence is observed when the price of a financial instrument and its indicator is moving in opposite directions. In other words, the two trends (price and indicator) are moving further away from each other. Let us see this on a chart below for easier understanding:
As can be seen in the chart above, the Bearish divergence was identified as the price was making higher highs while RSI was making lower highs hence giving a sign of exhaustion in the bullish momentum. This sell (short) trade carried on the bearish momentum for the next 2 weeks as highlighted through the vertical lines above. To learn more, you may refer to our blog about Convergence and Divergence.
William’s Alligator
Since we already covered Moving averages, now would be the right time to touch upon this indicator. The Indicator was derived by Bill Willams with the notion that the markets are only trending 30% of the time and remain consolidated 70% of the time. Thus, ideally, it can be used on higher time frames such as daily or weekly to determine the directional bias of any financial instrument. It is favored more by swing traders who prefer to hold on to positions for a longer duration.
The idea behind this indicator is to sit back and observe when the market is in a consolidated range and enter the market as soon as it starts trending as swing traders’ main goal is to identify the longer-term trend.
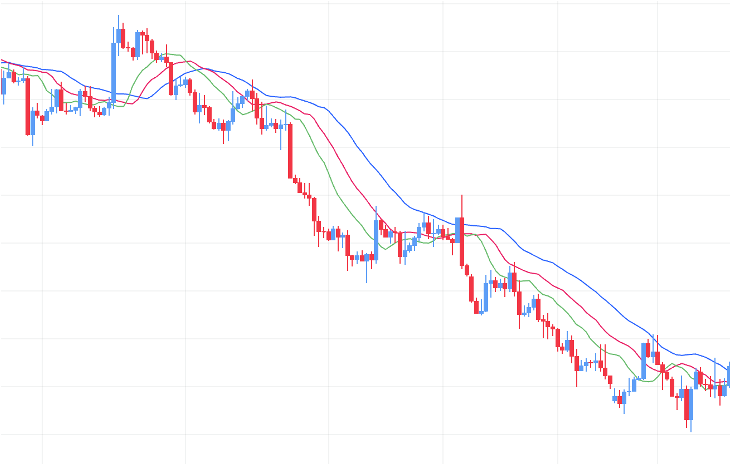
- The green line is the 13-period smoothed moving average which is called the ‘Jaw’ of the Alligator.
- The red line is the 8-period smoothed moving average which is called the ‘Teeth’ of the Alligator
- The blue line is the 5-period smoothed moving average which is called the ‘Lips’ of the Alligator.
The consolidated range is observed when the 3 balance lines (jaw, teeth, and lips) cross each other which indicates a period of sideways movement. This is when the Alligator is sleeping (look at it as the calm before the storm)
The trending range is observed The Alligator starts eating as soon as it wakes up, which is observed when
- Green line (Jaw) > Red line (Teeth) > Blue line (Lips) for a bullish move.
- Green line (Jaw) < Red line(Teeth) < Blue line (Lips), for a bearish move.
Let us now visualize a bearish move with an Alligator indicator through a chart for easier understanding:
(Please note that the best timeframe to analyze this on would be between 1H-4H to be able to capture decent pip size on an instrument over a longer duration i.e., over a few hours to a few days)
To learn more, you may refer to our blog about William’s Alligator.
Candlestick patterns
Candlestick patterns are widely used by swing traders to analyze price action, identify potential trend reversals or continuations, and make trading decisions. Among the many candlestick patterns that swing traders can identify, Bullish and Bearish engulfing candles are known to be one of the most effective candlestick patterns.
Bullish and Bearish Engulfing: The Bullish engulfing pattern occurs when a small bearish candle is followed by a larger bullish candle that completely engulfs the previous candle’s range. It suggests a potential bullish reversal. Conversely, the Bearish engulfing pattern occurs when a small bullish candle is followed by a larger bearish candle that engulfs the previous candle’s range. It indicates a potential bearish reversal.
The idea is to identify these candles on a 4H to Daily timeframe to be able to capture large pip movement with a decent risk-to-reward ratio.
To identify a bullish engulfing pattern, the following conditions should be met:
Previous Candle: The pattern occurs after a downtrend or a period of bearish price action. The preceding candle should be bearish, indicating a downward movement in prices.
Body Size: The bullish engulfing candle has a larger body compared to the preceding bearish candle. The body of the bullish candle engulfs or completely covers the entire range of the preceding bearish candle, including both the body and the shadows.
Bullish Close: The bullish candle should close near its high, suggesting that buyers have taken control and pushed the price higher during the period. The strong bullish close indicates increased buying pressure.
Once the Bullish engulfing pattern is observed, it shifts the market sentiment from bearishness to bullishness. The pattern indicates that buyers have overwhelmed sellers, potentially leading to a change in the trend and the beginning of an upward movement in prices. Identifying this on a higher timeframe is what swing traders would potentially hunt for.
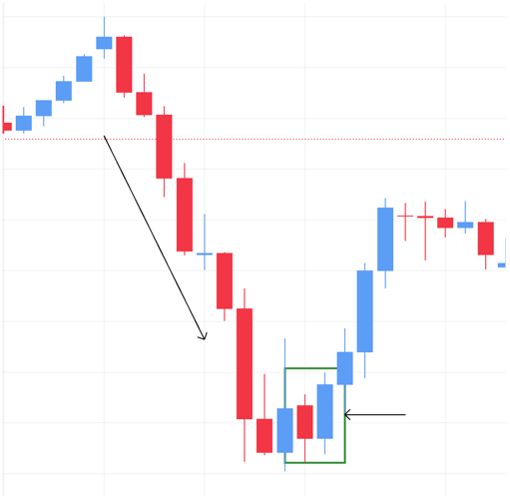
Let us visualize once again through the chart below for easier understanding:
As it can be seen, it is identified in a downtrend, it engulfs the body of the previous bearish candle and the bullish body is larger than the previous bearish body. To learn more, you may refer to our blog about candlestick patterns.
Trading Breakouts of trend lines or support or resistances
Last but not least, trend lines play a crucial role in identifying the long-term trend if drawn on larger time frames. This can be used in two ways:
- A swing trader can follow the trend and enter positions at the bottom or top of the trend line in which case one is executing a position in favour of a trend continuation.
- A swing trader can wait for the trend to break first in which case one is executing a position in anticipation of a trend reversal.
To learn more, you may refer to our article on trend lines.
Swing traders also utilize support and resistance levels as key elements in their trading strategies. Support and resistance are price levels at which the buying or selling pressure has historically caused the price to reverse or pause. You may refer to our blog about Price Action strategies to learn more about trading strategies using support and resistance.
Note:
Please be mindful that there is no one or fixed way of trading using any indicator. However, understanding how the indicators work can help traders in identifying the long-term direction of the market. Once the bias is confirmed, swing traders can move on to a smaller time frame to time their entry and exit. Traders can also use different tools on top of it to have multiple confluences to confirm their trade entry.


