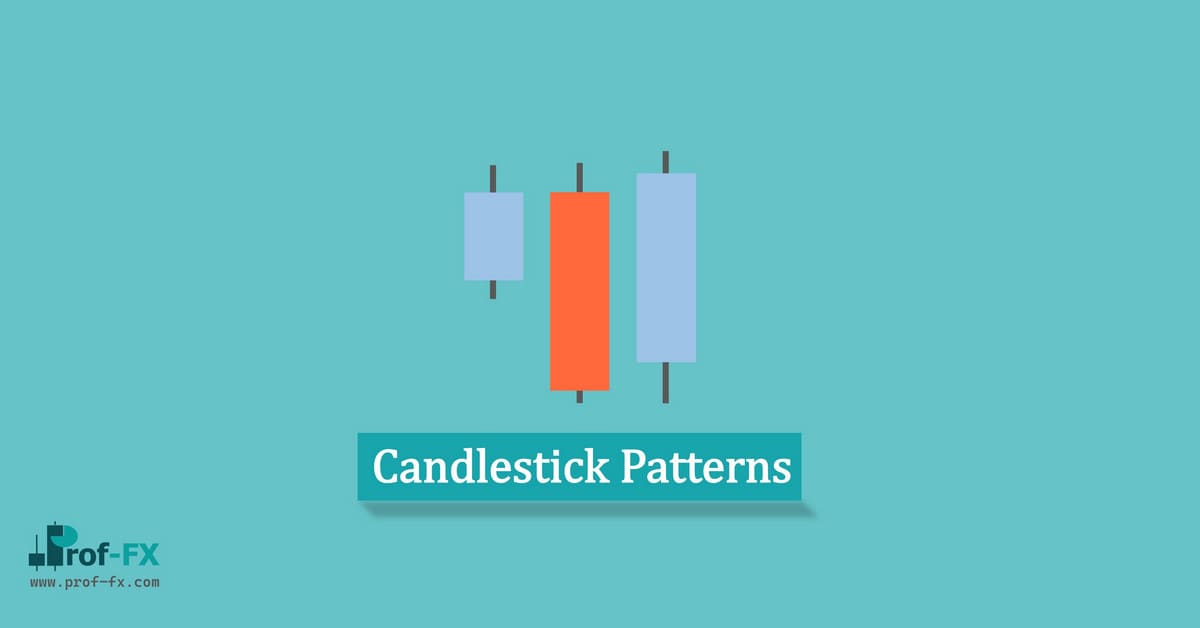
In candlestick patterns basics, we’re going to start right at the beginning with how to interpret candles.
Each candle represents what price has done over a specific period of time. So, for example, let’s say you are looking at a 1-hour price chart; each candle will represent one hour and will show:
- Where price was at the start of that hour
- The lowest price reached during that hour
- The highest price reached during that hour
- Where price was at the end of that hour
The Most Basic Candlesticks
The simplest candles are the bullish candle and the bearish candle.
A bullish candle represents buyers overpowering sellers and is indicative of; yes you guessed it, bullishiness. And in a similar way a bearish candle represents selling activity being greater than buying activity and demonstrates bearishness.
Single Candle Patterns
Dojis, hammers and shooting stars
Next to the bullish candle and bearish candle the doji candle is probably the one most traders will be familiar with.
A doji candle occurs when the close of a candle is the same price as the open. There are two main types of doji candles. The first type indicates indecision in the market. The upper shadow and lower shadow will be of similar length and quite often you will get a few of these dojis one after the other.
Here are a few examples of the indecision style of doji candle:
What is happening with this type of doji is that buyers and sellers are in balance. The traders buying and the traders selling have currently reached a price where they are in agreement.
The other type of doji is what is called the ‘reversal’ doji; here is what this type of doji looks like:
So what is happening here? For the bullish reversal doji we are seeing sellers taking price lower and then buyers overpowering these sellers and taking price higher. This is a sign of bullishness as price tried to go down, could not stay down, and then was pushed back higher again.
The same is true for a bearish reversal doji; buyers took price higher and then seller came in and forced price back down again – a bearish indication for sure.
Reversal dojis also have very similar related bars; the bullish doji has a similar candle called a hammer; and the bearish doji has a similar candle called a shooting star. The hammer and shooting star candles are pretty much the same as their related reversal dojis except their closes and opens do not have to occur at the same price.
Example of hammers and shooting stars:
Bullish reversal dojis and hammers can regarded as the same – the difference is minor; this is the same for bearish reversal dojis and shooting stars.
Let’s take a look at some examples of bullish and bearish reversal dojis, hammers and shooting stars in action:


