Forex trading is a complex market, and traders are always on the lookout for tools that can help them make better trading decisions. The Stochastic Oscillator is one such technical indicator that can help traders identify potential buy or sell signals based on the momentum of price movements. In this blog post, we will discuss what the Stochastic Oscillator is, how it works, and how traders can use it to identify buy and sell positions accurately.
What is Stochastic Oscillator?
The Stochastic Oscillator is a technical indicator developed by George Lane in the 1950s. It is a type of momentum indicator used in technical analysis to determine whether an instrument is overbought or oversold based on its price movements over a specific period of time.
By comparing the current price level to the highest high and lowest low within the chosen period, the oscillator expresses the latest price level as a percentage of the range. This calculation enables traders to identify potential trends and make informed decisions about buying or selling the instrument.
The two key determinants of the Stochastic Oscillator are %K and %D. Let us now look into these formulae for easier understanding:
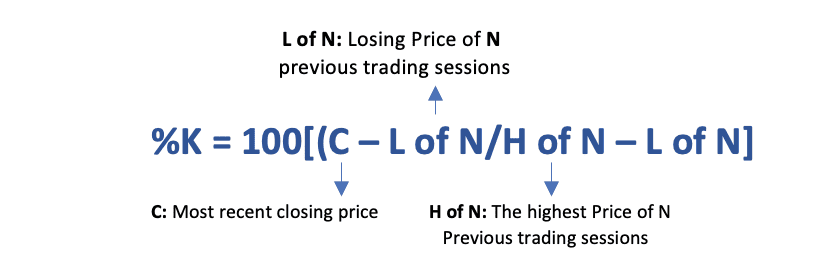
The formula for calculating %K is as follows:
*The default number for N is 14, this could be either weeks, days, or hours.
The formula for calculating %D is as follows:
This is a 3-day period moving average of %K
Where:
- C is the last closing price
- L of N is the lowest low for the time period (N)
- H of N is the highest high for the time period (N
Now that we have defined the Stochastic Oscillator through the Formula, we learned that it comprises of two lines, the %K and the %D, which are plotted on a chart.
%K line: is the faster line and is more sensitive to price movements.
%D line: is the slower line and is less sensitive to price movements.
The Stochastic Oscillator is used to identify overbought and oversold conditions which help to identify potential buy and sell signals for any given instrument on any given time frame. Let us now shed light on how it works.
How Does Stochastic Oscillator Work?
As defined previously, the stochastic oscillator is a momentum indicator that compares the current closing price of an instrument to its price range over a given period of time. Now we will shed light on how %K and %D defined previously help us to identify the overbought and oversold conditions. The %D line is a moving average of the %K line. Both of these lines are plotted on a graph side by side. The stochastic oscillator is range-bound, so it is always ranged between 0 and 100.
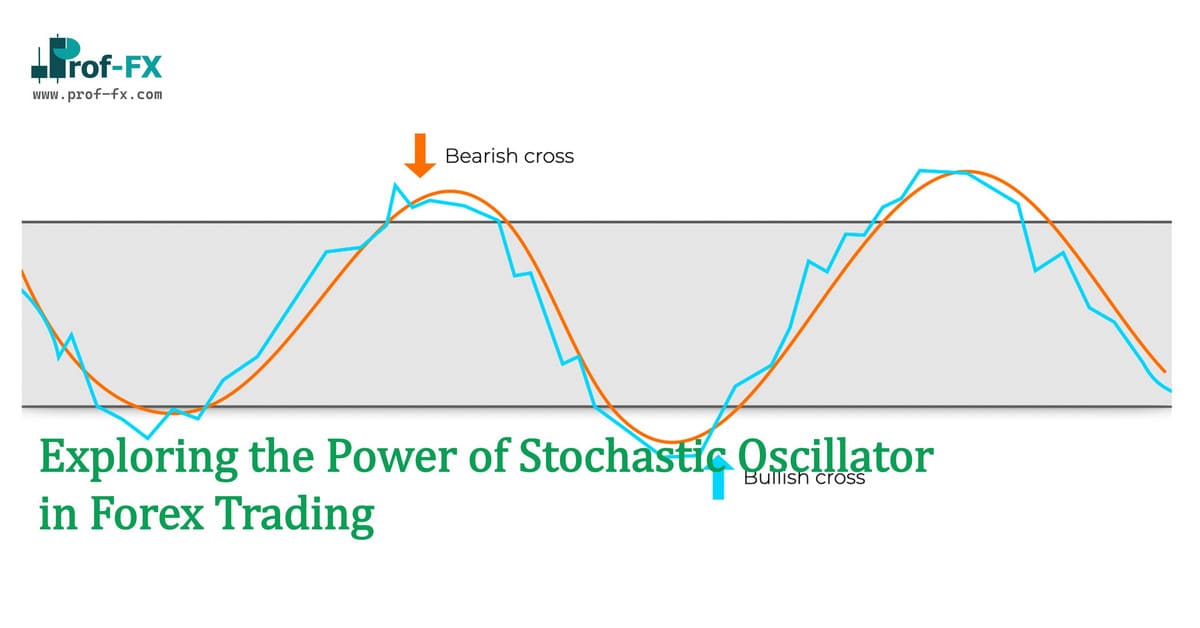
A trader needs to analyze the fluctuations between these lines to indicate overbought and oversold conditions. Let us now demonstrate through the graph below for easier understanding:
In the graph above, we have identified the following four elements:
- Oscillator range: this range is 80 for the higher bound and 20 for the lower bound.
- Overbought condition: When the two lines are seen above 80, it is considered to be an overbought condition and it hints for a potential sell entry.
- Oversold condition: When the two lines are seen below 20, it is considered to be an oversold condition and it hints for a potential buy entry.
- 3-day SMA of %K:
There are two types of Stochastic Oscillators: slow and fast. The slow Stochastic Oscillator uses a longer period of time and is less sensitive to price movements. The fast Stochastic Oscillator uses a shorter period of time and is more sensitive to price movements. Traders can use both slow and fast Stochastic Oscillators to identify potential buy or sell signals.
%K: is referred to as the fast stochastic indicator. Whereas
%D (3-period moving average of %K): is taken as the slow stochastic indicator.
The slow Stochastic Oscillator is better suited for identifying long-term trends, while the fast Stochastic Oscillator is better suited for identifying short-term trends.
Now that we have examined and understood how the Stochastic Oscillator works, let us move on to highlight the ways it can be brought to use to identify potential buy and sell trade entries.
How to Identify trade entries using Stochastic Oscillators?
The three most common ways the Stochastic Oscillator can be brought to us are as follows:
Identify Overbought and Oversold conditions
As we highlighted earlier, a reading above 80 indicates an overbought condition which depicts that the buy momentum has exhausted and the sell reversal is imminent whereas a reading of below 20 indicates an oversold condition which depicts that the sell momentum has exhausted and the buy reversal is imminent. Let us look at the chart below for easier understanding:
Identify Divergence:
Divergence is pointed out when the price of a financial instrument and its indicator are moving in opposite directions. In other words, the two trends (price and indicator) are moving further away from each other.
This in turn implies that divergence is a signal of trend reversal. Hereafter, we will place our focus on how to identify and trade divergences using Stochastic Oscillator. Let us first view it through a chart for easier understanding:
What we have identified above is a Bullish Divergence with the use of Stochastic Oscillator. As we can see that the price went lower to make a new low. However, the oscillator shows a higher low which indicates exhausting sell momentum. Likewise, for a Bearish Divergence, we will observe the Price rising higher i.e., the Price observing a higher high but the Oscillator would make a lower high.
However, trades should be based on divergence alone. It is very crucial to observe proper risk management alongside looking at multiple other confluences as per the strategy to confirm the trade entry.
Note: The Stochastic Oscillator may give a divergence prior to price action changing direction. For instance, when you identify a bearish divergence through the use of the oscillator, the price may continue to rise higher for some time before turning to the downside. A trader must keep an eye on all time frames to better synchronize the trade entry. This is also stressed by the creator of Indicator, Lane, himself to first wait for confirmation through other confluences for a market reversal.
Use of Cross overs of %K and %D
The oscillator generates buy and sell signals based on the crossover of the %K and %D lines and their positions relative to certain levels, usually 20 and 80. Let us again demonstrate this through a chart below for easier understanding:
For Buy positions: Cross over of %K above %D identified below 20 gives a potential buy signal
%K > %D – Below 20 – Potential Buy
For Sell positions: Cross over of %K below %D identified above 80 gives a potential sell signal.
%K < %D – Above 80 – Potential Sell
It would not be just to not look at the Limitations of the Stochastic Oscillator, therefore let us shed some light on potential limitations:
The stochastic oscillator is a popular technical analysis tool used by traders to identify overbought and oversold conditions in the market. However, it has several limitations that traders should be aware of.
- Firstly, it is a lagging indicator, meaning it relies on past price movements to generate signals. As a result, it may not be suitable for predicting future price movements accurately.
- Additionally, the stochastic oscillator can provide false signals, especially in trending markets where prices can remain overbought or oversold for extended periods. Lastly, the stochastic oscillator is not suitable for all types of securities and may not work well in volatile or thinly traded markets.
The Stochastic Oscillator is a useful tool for forex traders to identify potential buy and sell signals based on the momentum of price movements. Traders can use the Stochastic Oscillator to identify oversold and overbought conditions, bullish and bearish divergences, and line crosses to improve their trading strategies. However, it is important to use other indicators and analysis to confirm potential buy or sell signals from the Stochastic Oscillator, especially in range-bound markets.


