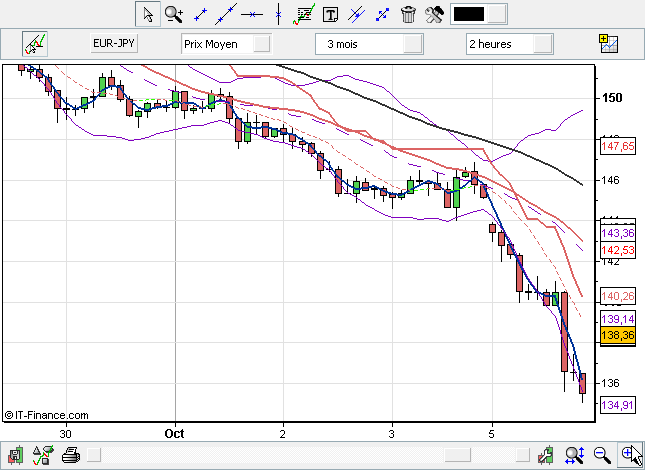
The Dow classic method wants us to take a long position each time a highest is overrun, with a stop loss at the last lowest.
Conversely, each new lowest broke requires to take a short position.
This implies that you are always in position because every stop loss open implies a further opening position. And if the movement continues, the total amount of our position increases.
The amount of position is of course calculated according to money management.
The dow’s method can be criticize because the stop loss is too close to price. Indeed, if the market up for example and that each new candlestick offers us a new low, every correction will stop us and we will be place in the opposite side. It is therefore preferable to not stick to price and let the highest and lowest be really formed to move the stop.
The method is very effective on a parity trend because we will benefit the general movement. However, a parity which goes up and down, and therefore does not make a particular direction, will constantly execute your stop, and we will lose the risk taken each time.
That’s why, we must analyze the trend of a parity. If that one is neutral, it is better to wait until the trend will be confirmed to start the method. We will have time to take a position on an overrun of highest or lowest thereafter.
Trend confirmed
To see if the trend is confirmed, all technical indicators can be used.
Parity without any trend
Moving averages cross all the times. No gauge of moving average. RSI is neutral around 50.
The method is still applicable, but you must stick to price in moving your stop to enjoy all the small movement of up and down.
The problem with this method often lies in the fact that we do not have sufficient margin (risk taken on the first trade is too high). Altought, you must take a position if a highest is overrun, even you already have one. Another problem: we are not always in front of the computer to take all positions, and make reversals.
Remedy
You are in a parity trend. You expect it to correct. You enter on a last highest or lowest. The amount of your position will be more important because the distance to the stop is smaller.
Example by image: you just missed the train leaves. You wanted to enter short on the last lower.
You are fed up to have missed this movement. Take it easy, wait a correction. That is the price to pay to not be 24/24 in front of your computer. But don’t be affraid, this is nothing. You wait.. All above no entry now!
Next:
Here, it is good for an entry. The new lowest is the 30 of October at 18h. Last highest to 12pm. We just have to calculate the amount of your future position, if the lowest is broken. Stop at the highest.
Next:
Your profit is about 4 to 5 times the risk undertaken …
(ok, the guy who entered at the first break, made jackpot … But he burns his eyes 24/24 on his computer …)
PS: Stops seem far to you … Normal, I’ve done it on 2h … There was nearly 250 pips to the stop. But the same thing can be done on any Timing.
Example of a trade on a perfect movement
The red segments are all the moving of your Stop.
(It is true that it we had open a new position each time the highest is overrun, the final outcome of the trade would have been tremendous)


