Mastering the double top pattern can significantly enhance a trader’s technical analysis toolbox. This versatile pattern is widely applicable, whether trading forex or stocks, and is a key element in identifying potential market reversals.
Double Top Pattern: Key Highlights
- What defines a double top?
- Steps to spot a double top pattern on forex charts
- Applying the double top pattern in trading strategies
- Explore more about trading with technical patterns
What is a Double Top?
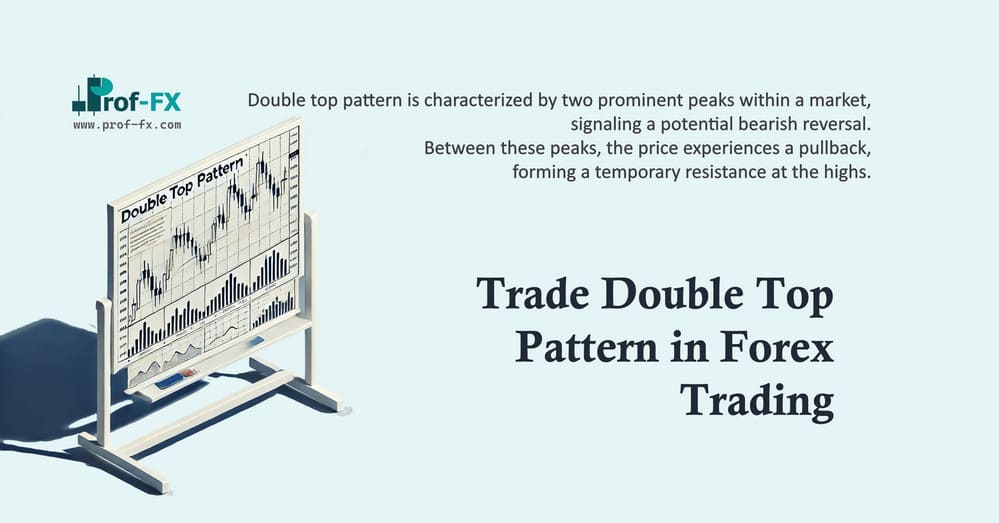
A double top pattern is characterized by two prominent peaks within a market, signaling a potential bearish reversal. Between these peaks, the price experiences a pullback, forming a temporary resistance at the highs. Following the first peak, the market retraces before rallying back toward the previous high. However, the momentum often diminishes, failing to break above the initial peak.
Indicators like the Relative Strength Index (RSI) can highlight this loss of momentum, often showing a lagging peak. Occasionally, the market might briefly exceed the first peak before reversing lower. This short-lived break can draw bullish sentiment, only to trap traders as the trend reverses. A bearish confirmation occurs when the price breaks below the “neckline,” the support level formed at the lowest point between the two peaks.
Interestingly, the double top pattern has a bullish counterpart known as the double bottom. While the double top signals bearish reversals, the double bottom indicates bullish reversals. Both patterns are powerful tools, applicable across major financial markets, including forex.
How to Identify a Double Top Pattern on Forex Charts
Follow these steps to spot a double top pattern:
- Look for two distinct peaks of similar height and width.
- Ensure adequate spacing between the peaks, dependent on the time frame.
- Confirm the neckline or support level between the peaks.
- Use additional technical indicators like moving averages or oscillators to validate the bearish signal.
Using the Double Top Pattern in Trading: Key Tips
Double tops are a favorite among traders in forex and stock markets, offering clear sell or bearish signals. The following examples demonstrate how this pattern is used in different markets, emphasizing trade entry and exit points.
USD/JPY Double Top Chart Pattern:
The weekly USD/JPY chart above illustrates a classic double top pattern. After an uptrend, the first peak reaches a resistance high, coinciding with an overbought RSI signal. A decline follows, creating the characteristic dip before the second peak forms. The second peak slightly surpasses the first but fails to sustain momentum, as shown by the RSI divergence, signaling a bearish trend.
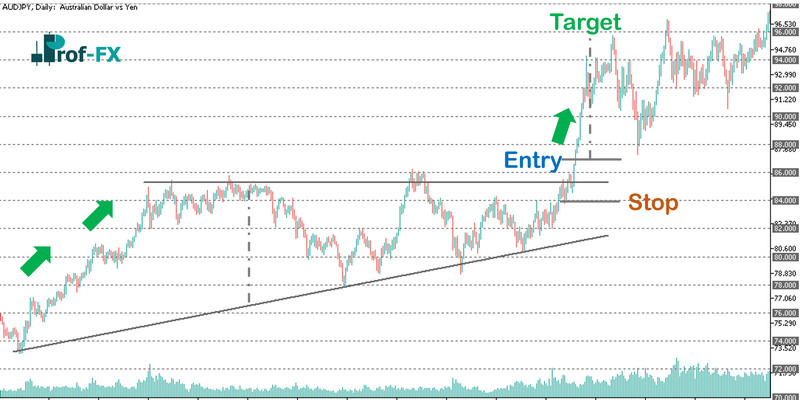
The trade entry is confirmed when the price closes below the neckline. The stop-loss level can be set at the resistance line connecting the two peaks, while the target can be established at the swing low before the pattern’s formation. Alternatively, Fibonacci retracement levels can guide stop and limit placements. This trade example demonstrates a risk-reward ratio of approximately 1:1.2, adhering to sound risk management principles.
Ryanair Holdings PLC (LSE) Double Top Chart Pattern:
Stock charts often appear smoother compared to forex charts due to lower market volatility. In this example, the double top pattern on Ryanair Holdings PLC shares is validated using a stochastic oscillator, highlighting its adaptability to various markets.
After forming the second peak, the pattern allows traders to enter early, capitalizing on the anticipated downward move. The stop-loss is placed at the first peak’s high, and the neckline serves as the take-profit level. Overbought signals from the oscillator confirm the entry, ensuring additional precision.
Conclusion
When used correctly, the double top pattern is a powerful tool for traders. Supplementing this pattern with other technical indicators enhances its reliability, making it suitable for diverse markets.
Learn More About Trading with Technical Patterns
Before diving into complex patterns, understanding candlestick charts is essential. Check out our guide, How to Read a Candlestick Chart, for a comprehensive introduction. For more insights on leveraging candlestick charts in forex trading, explore our Trading Candlesticks article.


