MACD, invented by G. Appel is referred to as an oscillator technical indicator. MACD (
Moving Average Convergence/Divergence ) consists of 3 exponential moving averages with default settings Fast EMA (12), Slow EMA (26) and MACD SMA (9).
MACD SMA (9) is referred to as the signal line and shows the 9-period EMA of the difference between the Fast EMA and the Slow EMA. Unlike may other technical oscillators, the MACD has no upper or lower boundaries.
MACD Histogram Calculation
- MACD Histogram = MACD – Signal Line
- MACD = 12-period EMA – 26 period EMA
- Signal Line: 9-period EMA of MACD
NZD/USD Moving Average Convergence/Divergence Histogram (MACD) Hourly Chart
Type of technical indicator: Oscillator
Forex signals from MACD
There are many ways in which you can trade signals from MACD. Please find below how i use them to my advantage.
1. In trending markets
1.a In up trends, go long near rising trend lines or rising moving averages when the MACD histogram turns positive from below (above the zero line 0.00).
1.b In downtrends, go short near falling trend lines or falling moving averages when the MACD histogram turns negative from above (below the zero line 0.00).
MACD long trade example in an up-trending market determined by a 200 exponential moving average
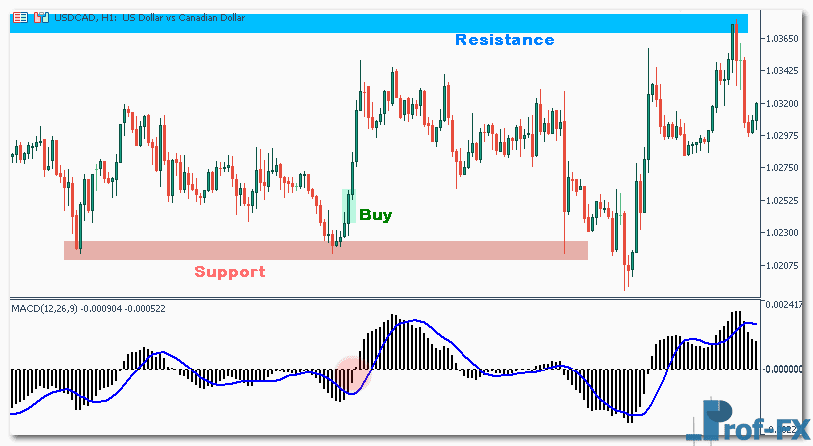
2. In range bound markets
2.a Long trades
- 2.a.1 Look for long trade opportunities near important levels of support.
- 2.a.2 Wait for negative MACD histogram readings.
- 2.a.3 Go long when the signal line crosses the MACD histogram from below.
2.b Short trades
- 2.b.1 Look for short trade opportunities near important levels of resistance.
- 2.b.2 Wait for positive MACD histogram readings.
- 2.b.3 Go short when the signal line crosses the MACD histogram from above.
MACD long trade example in a range bound market (USD/CAD hourly chart)


