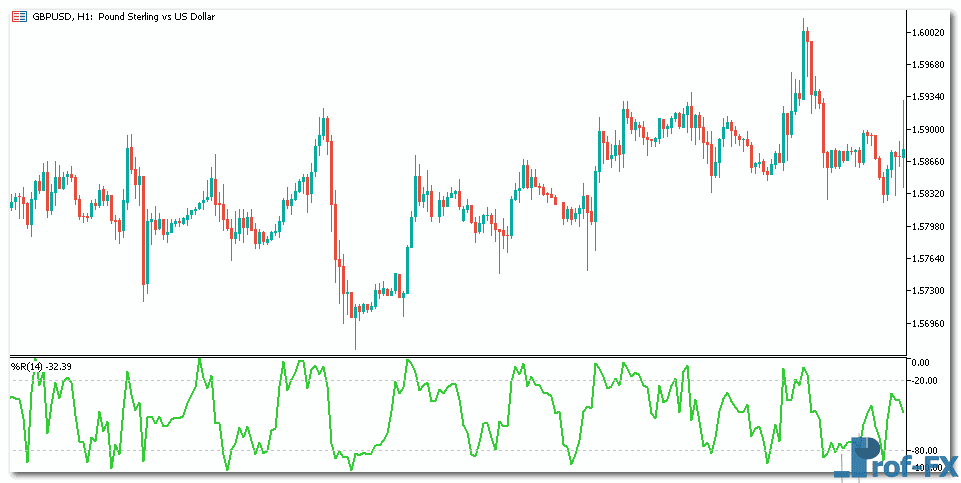
The Williams’ %R indicator, invented by Larry Williams measures momentum in the forex market. The Williams’ %R indicator oscillates between -100 and 0.
Readings above -20 are considered overbought while readings below -80 are considered oversold.
GBP/USD Williams’ %R Hourly Chart
Type of technical indicator: Momentum oscillator
Forex signals from the Williams’ %R oscillator
The approach is very similar to that of trading the Stochastic Oscillator.
1. In trending markets
Oversold values (-80 to -100): Look to buy dips in up trends.
Overbought values (-20 to -0): Look to sell rallies in downtrends.
2. In range bound markets
Oversold values (-80 to -100): Look for opportunities to buy near the low of the trading range.
Overbought values (-20 to -0): Look for opportunities to sell near the high of the trading range.
Powerful trading combinations with the Williams’ %R indicator
Always use in conjunction with other analysis tools/indicators to make better trading decisions in the forex market.
Our preferences: Candlestick patterns, trend lines and trend following indicators.


