As a forex trader, understanding market movements is key to making profitable decisions. One tool that can help you predict price movements is the leading indicator. But what exactly does this term mean, and how can it help your trading strategy?
What is a Leading Indicator?
A leading indicator is a technical tool used by traders to predict future price changes in the forex market based on past data. While no indicator can guarantee 100% accuracy, these tools offer valuable insights into where prices might head next. Traders can then combine these insights with other analyses to spot the best entry points into the market.
In contrast to leading indicators, lagging indicators look at past price data to confirm trends after they have already occurred. Essentially, while leading indicators are forward-looking, lagging ones are reactive.
Common Leading Indicators Every Forex Trader Should Know
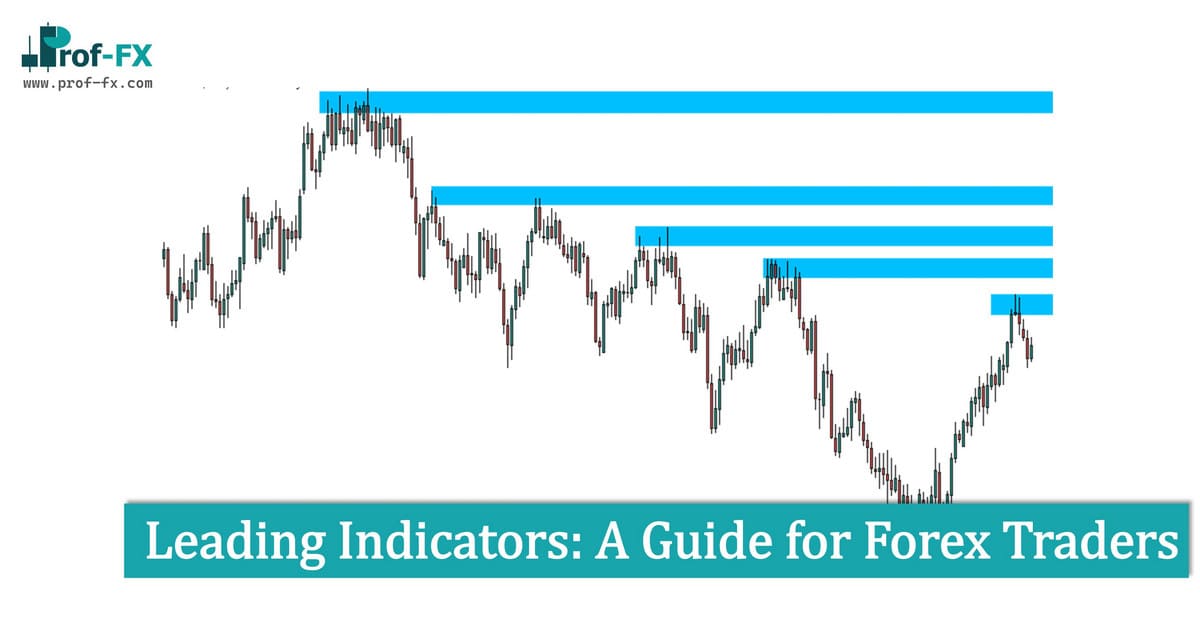
There are several well-known leading indicators that traders commonly use. These tools help to pinpoint future areas of support and resistance, and help you identify potential turning points in the market. Let’s take a look at a few of them:
- Fibonacci Retracements
- Donchian Channels
- Key Levels of Support and Resistance
Now, let’s break these down.
Fibonacci Retracements: Finding Support and Resistance Levels
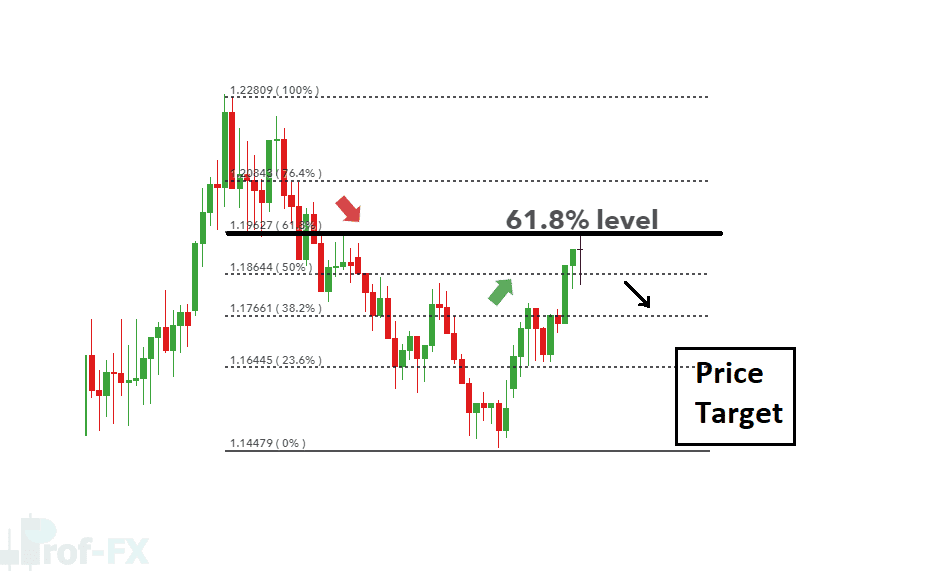
Fibonacci retracements are a favorite among forex traders because they offer insight into possible future price levels based on significant ratios derived from the Fibonacci sequence. The most important of these is the 61.8% level, which often plays a key role in determining support and resistance.
In forex, traders use these retracement levels to anticipate where the price might reverse or stall, thus highlighting potential entry points.
Example:
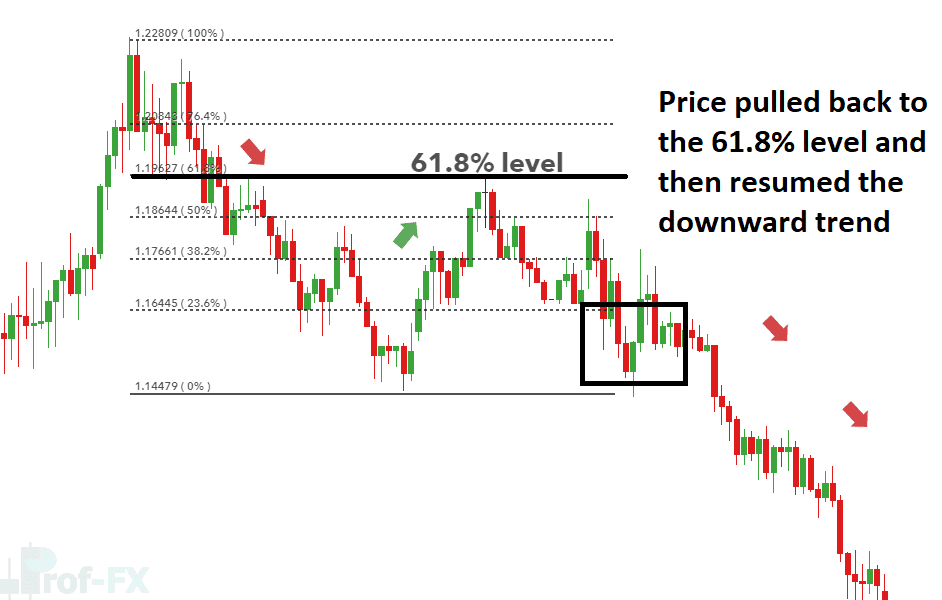
In the EUR/USD chart below, notice how the price respects the 61.8% Fibonacci level, signaling a potential market reversal.
As the price hits this level, the broader downtrend continues, and the market proceeds to create a series of lower lows, confirming the prediction made by the Fibonacci retracement.
Donchian Channel: Identifying Breakouts
The Donchian Channel is a tool that helps identify the highest highs and lowest lows within a specified number of periods. This channel adjusts as the price moves, providing traders with a dynamic view of the market.
For traders who are focused on breakouts, the Donchian Channel is especially useful. Here’s how it works in practice:
On the USD/JPY chart below, the price moves within the channel, initially making lower lows. When the price breaks the upper channel, it signals a potential bullish trend.
After touching the lower channel, the price rises and breaks above the upper channel line. This is seen as a bullish signal, indicating a possible long position for traders.
The upper channel line becomes resistance, and when the price breaks through this resistance, it confirms the trend’s strength.
Even though the price retraces between points (2) and (3), it doesn’t breach the lower channel, and eventually, it moves higher, forming a new high. This makes the lower channel an excellent reference for a trailing stop as the market advances.
Key Levels of Support and Resistance: The Backbone of Trading
Another crucial aspect of predicting future price movements is identifying key levels of support and resistance. These levels occur when the price repeatedly approaches a certain point without breaking through, creating a psychological barrier for traders.
By identifying these levels, traders can better estimate where to set stop-loss orders and target levels, improving the risk-to-reward ratio of their trades.
In the example below, the price hits resistance and then falls, which suggests placing a target near support, while setting a stop-loss above resistance.
Why Leading Indicators Are Essential for Traders
Leading indicators aren’t crystal balls, but they can offer valuable clues about the direction in which the market might move. By using them, traders gain a clearer understanding of potential price ranges, making it easier to set targets and stop-loss levels with greater precision.
Here are some of the key benefits of using leading indicators:
- Clear Directional Bias: They help traders identify the likely direction of price movement.
- Target and Stop Levels: They provide useful information for setting profit targets and stop-loss orders.
- Trade Filtering: Leading indicators can filter out trades that don’t align with market trends.
- Versatility: Traders don’t have to rely on just one leading indicator. They can combine multiple tools to confirm their analysis.
Leading Indicators: In Conclusion
While leading indicators are incredibly helpful, they are not foolproof. The forex market is full of uncertainties, and even the best indicators can’t guarantee results. That’s why risk management is essential, even when you’re confident in your predictions. Always use leading indicators as part of a broader strategy and combine them with sound risk management practices.
By integrating leading indicators into your trading routine, you can improve your ability to forecast future price movements, which gives you an edge in the market.
Become a Better Trader
The markets can be unpredictable, but with the right tools, you can make smarter decisions. To further enhance your skills, check out our articles on how to become a better trader. We also offer detailed forex forecasts, including insights on major pairs like EUR/USD and GBP/USD, to guide your market analysis.


