Elliott Wave Theory, introduced in the 1930s and named after its creator Ralph Nelson Elliott, is a widely known key analysis tool used by technical analysts to predict future market movements in various financial markets, including Forex. Typically, the Elliot Wave theory suggests that the price moves in waves or patterns repetitively and defines a set of rules to identify the price waves to predict future movement.
It is commonly used to forecast long-term trends. However, they can be identified on smaller time frames as well. This article aims to provide a comprehensive understanding of Elliott Wave Theory and its application in Forex trading.
Understanding Elliott Wave Theory
Ralph Nelson Elliott, a renowned accountant and stock market analyst, discovered the Elliott Wave Theory in the 1930s. Through extensive research and analysis of market data, Elliott identified repetitive patterns in the financial markets, forming the basis of this theory.
Elliott Wave Theory is based on the notion that market prices move in distinct patterns called waves. These waves consist of two types:
- Impulse (Motive) waves: Impulse waves move in the direction of the primary trend.
- Corrective waves: Corrective waves move against the primary trend.
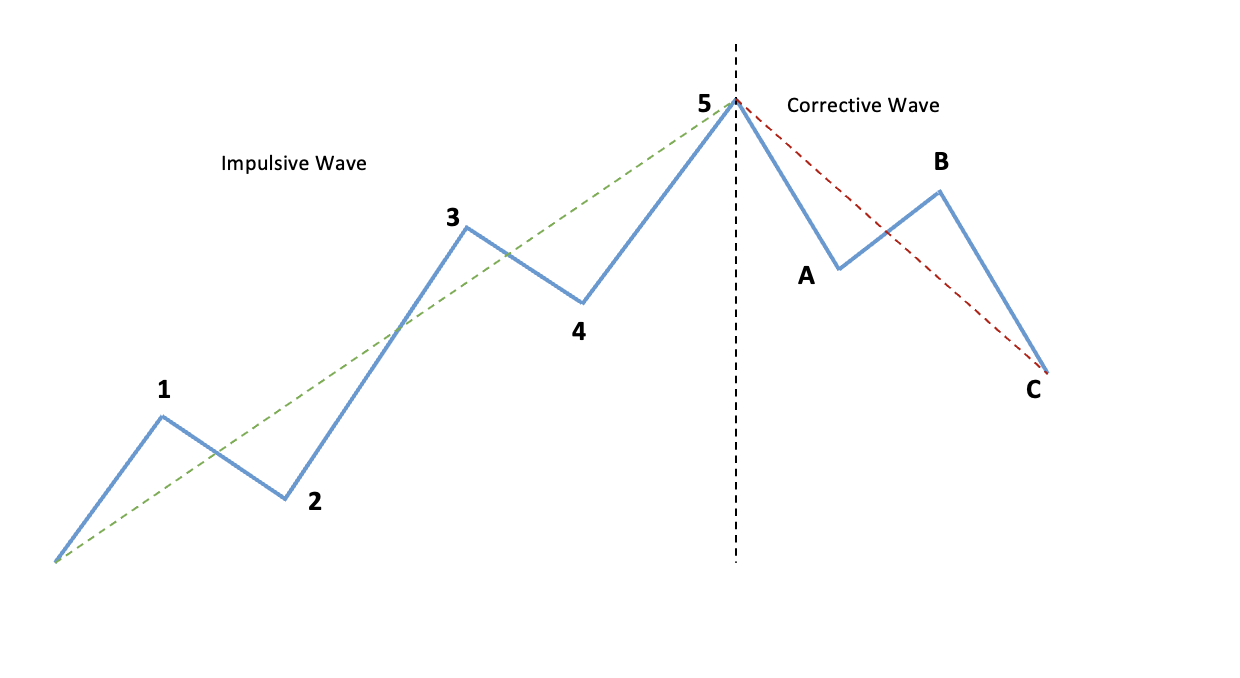
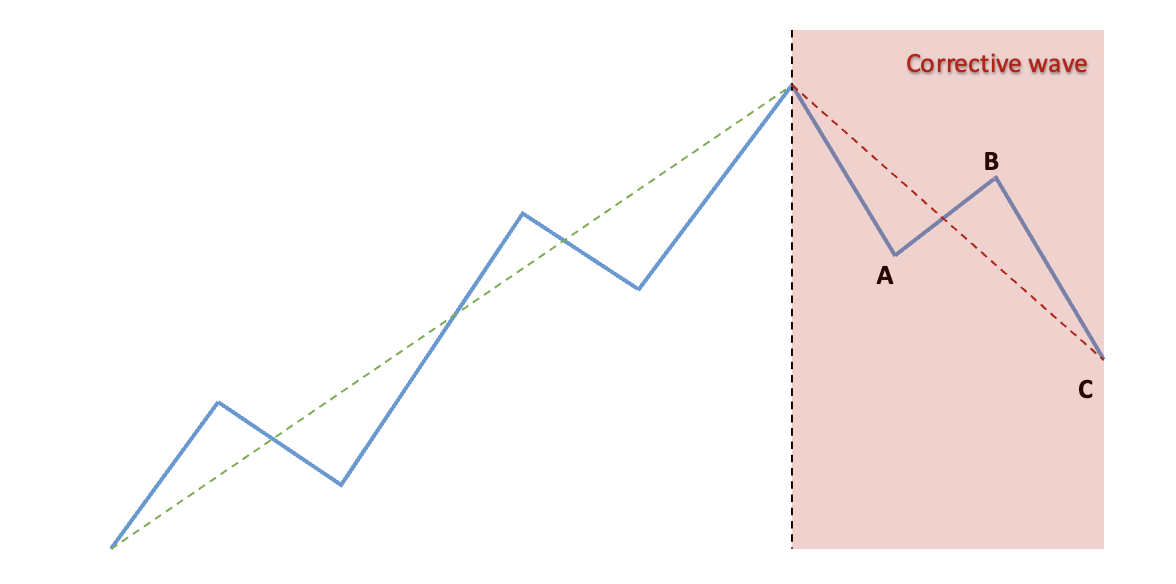
According to the Elliot Wave theory, the movements in the market would be observed in a certain five-wave structure. These waves are labeled as 1, 2, 3, 4, and 5, forming the motive wave, followed by a three-wave corrective pattern labeled A, B, and C. Let us first proceed by illustrating this in a bullish trend for easier understanding before digging into it further.
Illustration 1
We have divided the above image into two segments. The first segment is known as the Impulsive wave also referred to as the Motive Wave. The second segment is the Corrective wave.
Let us now break down the Impulsive wave:
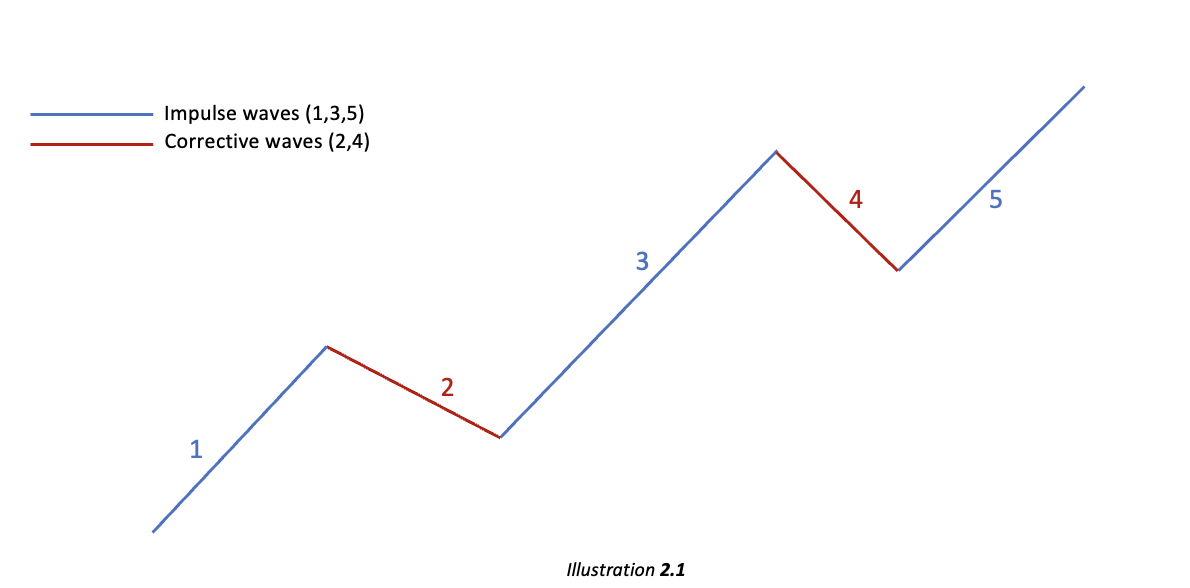
Impulsive wave or Motive wave is seen to continue the existing long-term trend whereas the corrective wave moves against the primary (larger degree) trend. We have already identified the Impulse wave comprising five waves (1,2,3,4,5) in the illustration above. These five waves comprise 3 impulse waves and 2 corrective waves as identified in the illustration below:
As can be seen above labeled impulse waves move higher in line with the primary trend (bullish) whereas the corrective waves move in the opposite direction of the primary trend.
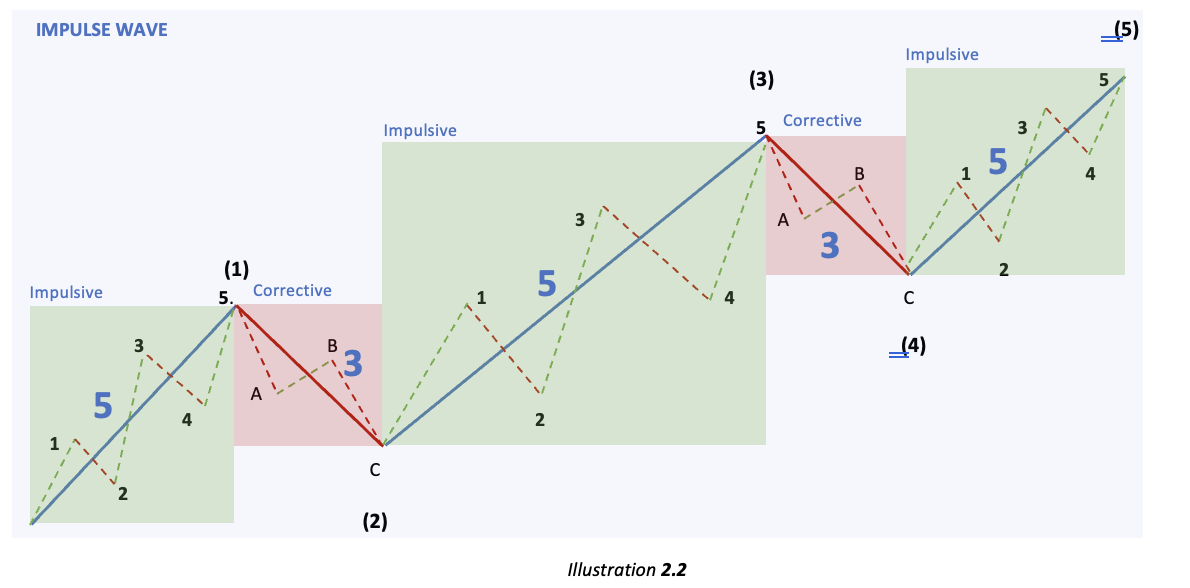
Every Impulse sub-wave can then be further divided into 5 waves and every corrective wave can further be divided into 3 waves. This forms the 5-3-5-3-5 structure as displayed below:
Let us briefly go over the illustration above to eliminate any confusion:
- The blue box represents the impulsive wave in 2.1.
- Green boxes refer to the three impulsive sub-waves (1,3,5) within a five-wave structure.
- Red boxes refer to the two corrective sub-waves (2,4) within a five-wave structure.
- A Five-wave structure can then be observed in each Impulsive sub-wave (1,3,5).
- A Three-wave structure can then be observed in each corrective sub-wave (2,4).
- Hence forming a 5–3-5-3-5 structure in an Impulse wave. Every Five-wave structure is formed for the impulse wave which is in the direction of the trend and every Three-wave structure is formed for the corrective wave which is opposing the trend.
To correctly identify the waves, there are three predefined rules to be met. Let us now go over the conditions that the waves should meet for the Elliot wave pattern to be valid.
Rule #1
Wave 2 should not go below the low of wave 1. In other words, wave 2 should not retrace more than 100% of wave 1 as displayed below:
Rule #2
Wave 3 should not be the shortest wave as displayed below:
Rule #3
Wave 4 should not go below the high of Wave 1 as displayed below:
Now that we have fully explained the Impulse wave, let us look into the Corrective wave:
Corrective wave comprises three sub-waves (A, B, and C) as labeled above. It is observed against the larger degree trend. The price level retraces back in an uptrend hence named the Corrective wave.
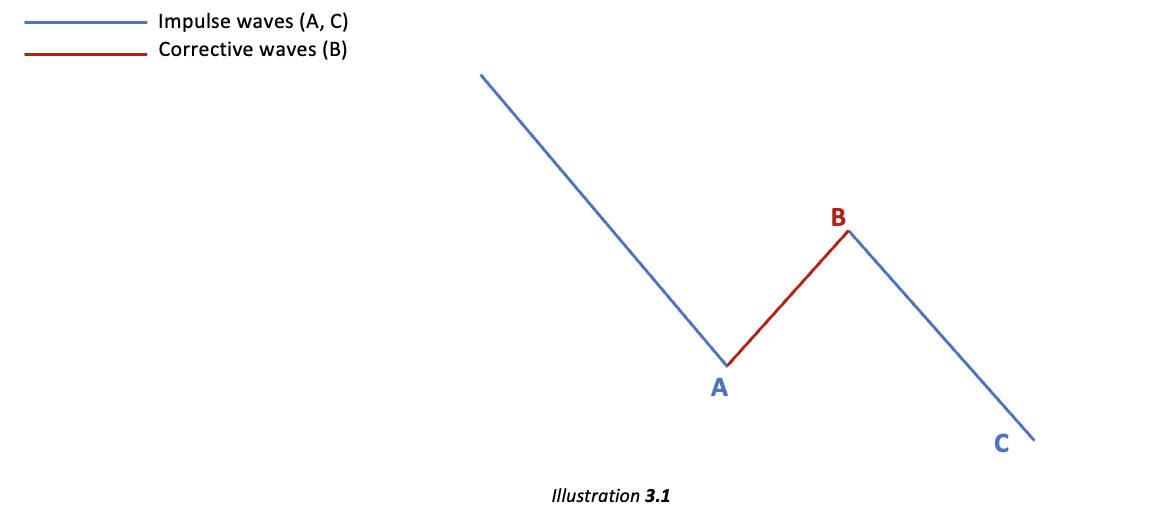
We have displayed the Corrective wave comprising three waves (A, B, and C) in the illustration above. These three waves comprise 2 impulse waves and 1 corrective wave as identified in the illustration below:
Wave A and C are looked at as Impulsive waves as they are following the trend of the correction i.e., the downward trend of the Corrective wave.
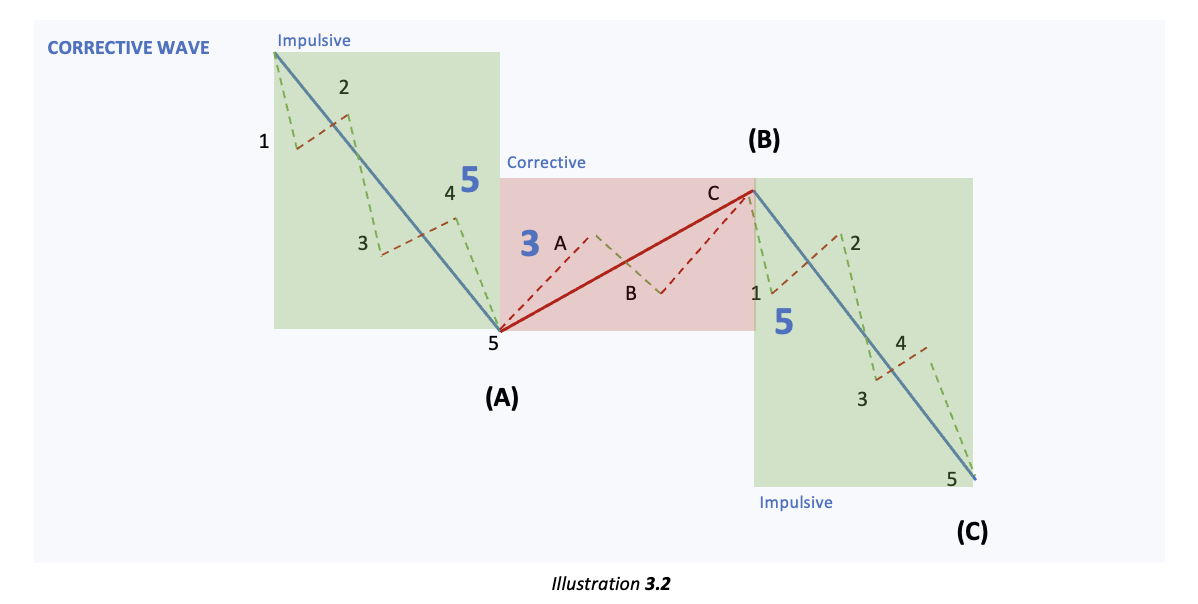
Every Corrective sub-wave can then be further divided into Five-waves for Impulse Wave A and C and into Three-waves for Corrective wave B (Wave B is a corrective wave as it is opposing the trend of the Corrective wave). This forms the 5-3-5 structure as displayed below:
Let us this time briefly go over the illustration of corrective sub-waves displayed above:
- The blue box represents the Corrective wave in 3.1.
- Green boxes refer to the two impulsive sub-waves (A and C) within a three-wave structure.
- Red boxes refer to the one corrective sub-wave (B) within a three-wave structure.
- A Five-wave structure can then be observed in each Impulsive sub-wave (A and C).
- A Three-wave structure can then be observed in each corrective sub-wave (B).
- Hence forming a 5-3-5 structure in a corrective wave. Every Five-wave structure is formed for the impulse wave which is in the direction of the higher degree trend and every Three-wave structure is formed for the corrective wave which is opposing the (higher degree) trend.
Applying Elliott Wave Theory in Forex Trading
To apply Elliott Wave Theory in forex trading, it is crucial to identify wave patterns accurately. Traders use various technical tools and indicators to recognize potential wave counts and determine the current market phase.
Fibonacci ratios play a significant role in Elliott Wave Theory. Traders often use Fibonacci retracement/extension levels to determine potential reversal points during corrective waves. These ratios act as a guide to measure the depth of retracements or extensions within a wave structure.
Below are the typical Fibonacci retracement and extension levels observed on the impulse waves:
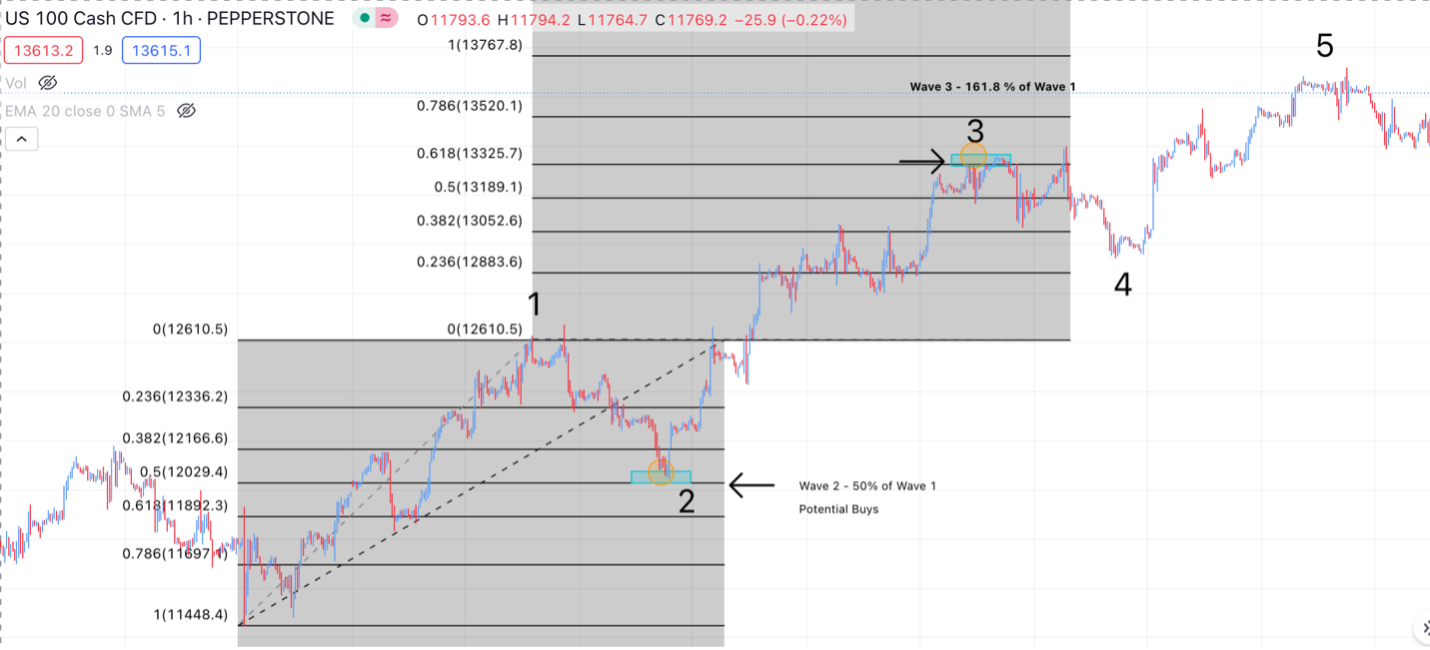
- Wave 2 usually retraces till 50% to 78.6% of Wave 1
- Wave 3 usually extends till 161.8% of Wave 1
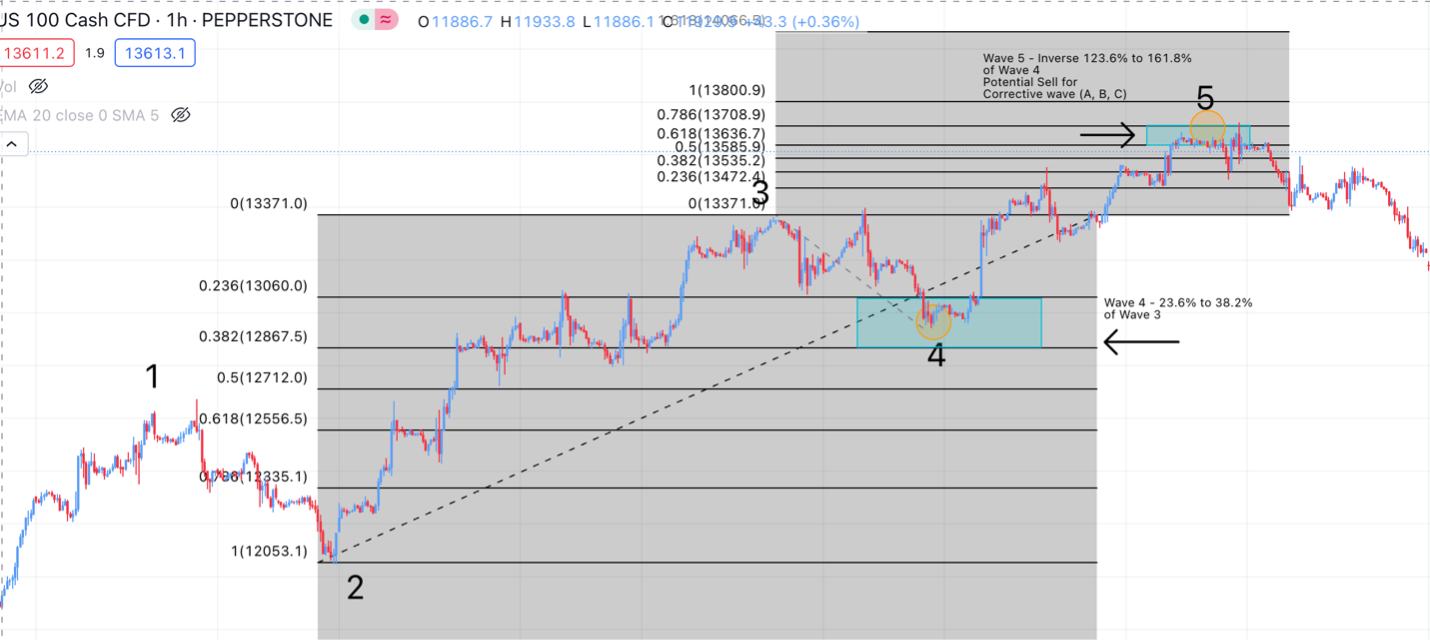
- Wave 4 typically retraces till 23.6% to 38.2% of Wave 3.
- Wave 5 usually is equal to wave 1 or is inverse 1.236% – 1.618% of Wave 4.
Let us look at an example below to see how Fibonacci retracements can assist us in finding potential trade entry if applied to Elliot Waves pattern:
*(To understand Fibonacci and its use as a tool for analyzing charts in trading, please refer to our blog: Trading Tips #5: Fibonacci Retracements)
Understanding the characteristics of impulse waves and corrective waves is essential for the successful application of Elliott Wave Theory. Impulse waves tend to be powerful and move in the direction of the overall trend, while corrective waves are smaller in scale and aim to correct the preceding impulse wave.
Assessing the Accuracy of Elliott Wave Theory
The accuracy of the Elliott Wave Theory remains a topic of debate among technical analysts. Some argue that it provides valuable insights into market behavior and can be a reliable tool when used correctly. Others question its predictability and argue that it is subjective and prone to interpretation biases.
One of the main challenges in applying Elliott Wave Theory is wave counting, which requires subjective judgment and expertise. Different analysts may interpret the same market data differently, leading to varying wave counts and potential forecasting discrepancies.
To enhance the accuracy of Elliott Wave analysis, technical analysts often combine it with supporting indicators and risk management techniques. These additional tools help validate wave counts and provide a more comprehensive understanding of the market dynamics.
To conclude
Elliott Wave Theory offers forex traders a unique perspective on market movements and potential future trends. While its accuracy remains a subject of debate, many traders find value in incorporating Elliott Wave analysis into their trading strategies. Understanding wave patterns, Fibonacci ratios, and differentiating between impulse and corrective waves are key elements in successfully applying this theory. Remember that proper risk management and the use of supporting indicators can help improve the effectiveness of Elliott Wave analysis in forex trading.


