You certainly heard about the Fibonacci sequence, remember: 1, 1, 2, 3, 5, 8, 13, 21, 34, 55, 89, 144 … … To get these numbers, it is very simple. You add the two first figures to calculate the 3rd. So 1+1 = 2; 1+2 = 3; 2+3 = 5 … any souvenirs?
Let’s go to the golden number now. The golden number is the ratio between two figures included in this sequence. First, we calculate the ratio between a number and its following. For example, 89/144 = 0618. It’s magical, when all the calculations are done with each number and its following in the sequence you will find this ratio. It is a golden number. Another ratio measures the relationship between a number and not its following but the next one. For example 55/144 = 0382. Still a golden number. So you have the origins of Fibonacci retracement. If you are a bit lost, it is not so important, it was just an introduction.
Fibonacci retracements
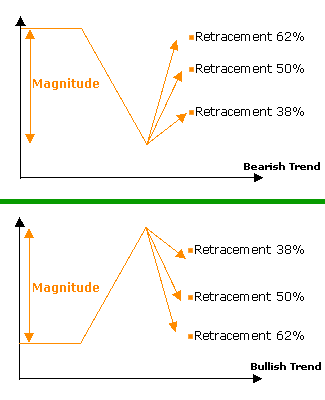
Now talk about the reason you’re here, the level of Fibonacci retracements: 23.6%, 38.2%, 50.0%, 61.8%, 100%. Fibonacci started from the principle that any upward or downward trend always has an end and the fact that a movement is not linear. So, an upward trend is marked by phases of corrections and a downward trend by phases of rebound. Those corrections or rebounds are called retracements.
To obtain areas of retracement, the calculation is simple. You just need to know the magnitude of the movement. Assuming that EUR/USD rose from 1.4010 to 1.4110. The magnitude of the increase is of 100 pips (1.4110-1.4010). To calculate areas of retracement you just have to use numbers of Fibonacci. Retracements will allow to determine support zones in the case of a bullish trend and resistances zones in a bearish trend.
To determine the retracement of 50.0% of the uptrend, you will make the following calculation: 1.4110-(0.0100*50%) = 1.4060 so a retracement of 50 pips.
For the retracement of 38.2%, you do the following calculation: 1.4110-(0.0100 *38.2%) = 1.4072.
In the case of a bearish trend, the calculation is the same but we start from the lowest. So, if you take the opposite of our previous example, that is to say a decrease of 100 pips from 1.4110 to 1.4010, the 38.2% Fibonacci retracement will be calculate like that:
1.4010 + (0.0100 * 38.2%) = 1.4048
Don’t worry, your broker’s tools on platform will do all this boring calculation for you. You will just have to select the highest and the lowest of the movement you’re focus on.
See a scheme of the Fibonacci retracements of an upward or downward trend (as in the example above):
Goals and applications
The Fibonacci retracements are used in the method of Elliott Waves. Of course, the Fibonacci retracements will not necessarily appear in all cases. Everything depends on the market if the market is very bullish, the retracement can only be of 23.6% of the increase because the majority of investors believe in the continuation of the uptrend and do not want to take their profits now. The upward trend will continue. Retracements areas act as resistance areas(in a downtrend) or support areas(in an uptrend), according to the trend and allow to set goals of take profit or stop loss. So, you could for example decide to cut your positions if the price break out the 38.2% Fibonacci retracement level of the trend that you’re playing.
Many investors also put their stops on these areas to enter or exit a trade. However, retracement of Fibonacci like any other indicator are better if they are used with others.
The retracement of a trend may also be of 100%. Most of the rime, if the 61.8% Fibonacci retracement level is break out, the price reach the 100% retracement. In this case, a reversal could happen if the trend continues. This is called Fibonacci extensions (1.000, 1.382, 1.618 ..) that can allow you to set price targets and take your profits.

